The Mathematics Behind the Magic: Understanding Spectrograms, Phase, and Waveform Processing
Demystify the mathematical foundations powering modern audio separation. From Fourier transforms to complex phase relationships, discover how mathematical elegance enables AI to understand music.
The Mathematical Foundation of Sound
Behind every breakthrough in AI music separation lies a profound mathematical insight. When we hear a symphony, our brains effortlessly separate the violin from the cello, the trumpet from the flute. But for machines, this seemingly simple task requires understanding the mathematical structure of sound itself.
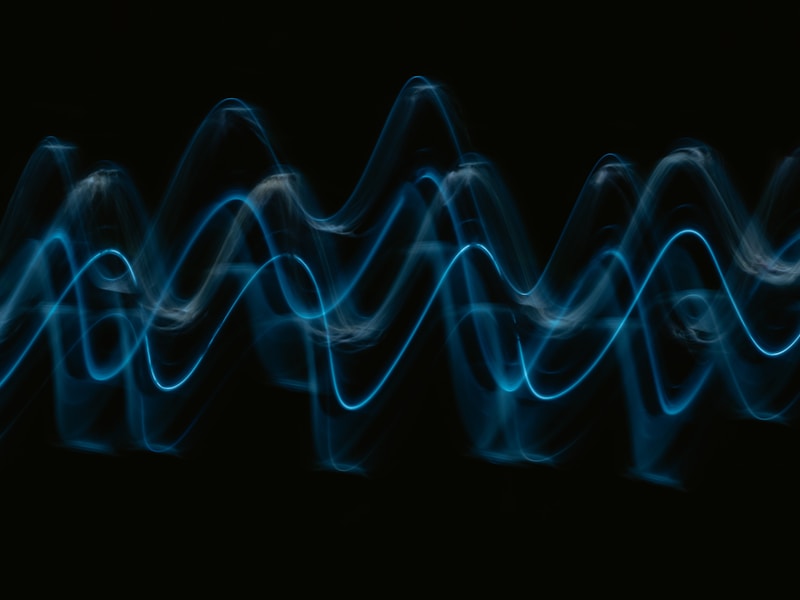
Sound is fundamentally a wave phenomenon—pressure variations propagating through air. But how do we transform these temporal vibrations into something a computer can understand, manipulate, and separate? The answer lies in one of mathematics' most elegant tools: the Fourier Transform.
🌊 From Waves to Understanding
The journey from raw audio to AI-powered separation follows a mathematical transformation pathway:
Time Domain
Raw waveform
Fourier Transform
Mathematical bridge
Frequency Domain
Spectrogram
AI Processing
Neural networks
The Fourier Transform: Mathematical Foundation
In 1822, French mathematician Joseph Fourier proved that any periodic signal can be decomposed into a sum of sine and cosine waves. This insight fundamentally changed how we understand complex signals.
The Continuous Fourier Transform
Where x(t) is time domain signal, X(f) is frequency domain representation
What it means:
- • Every signal has a "frequency signature"
- • Complex sounds = sum of simple frequencies
- • Time and frequency are dual representations
- • Information is preserved in transformation
Musical implications:
- • Notes have fundamental frequencies
- • Harmonics define timbre
- • Different instruments occupy different frequency ranges
- • Spectral separation becomes possible
Digital audio requires discrete versions of Fourier's continuous mathematics. The Discrete Fourier Transform (DFT) and its efficient implementation, the Fast Fourier Transform (FFT), make real-time processing possible.
The Discrete Fourier Transform (DFT)
For discrete samples x[n], compute frequency bins X[k]
DFT Properties
- • N samples → N frequency bins
- • Frequency resolution: Fs/N Hz
- • Computational complexity: O(N²)
- • Perfect for mathematical analysis
FFT Advantages
- • Same result as DFT
- • Computational complexity: O(N log N)
- • Real-time processing possible
- • Foundation of all audio software
The Short-Time Fourier Transform: Windows into Time
Music is not stationary—frequencies change over time as notes begin and end, melodies evolve, and rhythms pulse. The standard Fourier Transform loses all time information, which is problematic for dynamic signals like music.
The STFT Solution
Apply the Fourier Transform to short, overlapping windows of the signal, creating a time-frequency representation.
Where w[n] is the window function, m is the time frame
Window Function
- • Hann: Smooth, low leakage
- • Hamming: Sharp, good SNR
- • Blackman: Minimal leakage
- • Trade-offs in frequency resolution
Window Size Effects
- • Large: Good frequency resolution
- • Small: Good time resolution
- • Uncertainty principle applies
- • Typical: 1024-4096 samples
Overlap Strategy
- • 50% overlap common
- • 75% for high time resolution
- • Hop size = window_size - overlap
- • More overlap = smoother analysis
A spectrogram is simply the magnitude of the STFT plotted as a 2D image, with time on the x-axis, frequency on the y-axis, and color/intensity representing energy.
# Python implementation of spectrogram creation
import numpy as np
from scipy import signal

def create_spectrogram(audio, sr=44100, window='hann',
                      nperseg=2048, noverlap=1024):
    """
    Create spectrogram from audio signal
    """
    frequencies, times, Zxx = signal.stft(
        audio,
        fs=sr,
        window=window,
        nperseg=nperseg,        # Window size
        noverlap=noverlap,      # Overlap samples
        return_onesided=True    # Only positive frequencies
    )

    # Convert to magnitude spectrogram
    magnitude = np.abs(Zxx)

    # Convert to dB scale for better visualization
    magnitude_db = 20 * np.log10(magnitude + 1e-12)

    return frequencies, times, magnitude_db
Spectrogram Interpretation
Horizontal lines: Sustained notes
Vertical lines: Transients (drums)
Bright regions: High energy
Harmonics: Parallel horizontal lines
Formants: Vocal tract resonances
Noise: Vertical spread
The Phase Problem: Complex Numbers in Audio
The STFT produces complex numbers—each time-frequency bin has both magnitude and phase. While magnitude tells us "how much" energy is present, phase tells us "when" it arrives. This timing information is crucial for high-quality audio reconstruction.
Complex Representation
Polar form: magnitude × phase
Rectangular form: real + imaginary
Magnitude Information
- • Energy content at each frequency
- • Easily visualized as spectrograms
- • Captures harmonic structure
- • Used in most separation models
Phase Information
- • Timing relationships between frequencies
- • Critical for transient preservation
- • Affects stereo imaging
- • Extremely difficult to model
Most neural networks work with magnitude spectrograms only, discarding phase information. This creates a fundamental problem: how do we reconstruct high-quality audio without phase?
Common Solutions
Mixture Phase
Use original mixture's phase—simple but imperfect
Phase Estimation
Griffin-Lim algorithm iteratively estimates phase
End-to-End
Skip spectrograms entirely—work with waveforms
⚠️ Phase-Related Artifacts
- • Pre-echo: Transients appear before they should
- • Smearing: Sharp attacks become blurred
- • Stereo collapse: Loss of spatial information
- • Metallic sound: Unnatural reconstruction artifacts
Masking: The Mathematical Art of Separation
The core insight behind spectrogram-based separation: if we can estimate how much of each time-frequency bin belongs to each source, we can reconstruct the individual sources through multiplicative masking.
Mathematical Formulation
Mixture = sum of sources in T-F domain
Ideal Ratio Mask for source 1
Estimated source = estimated mask × mixture
Mask Types
- • Binary masks: 0 or 1, hard decisions
- • Ratio masks: [0,1], soft assignments
- • Complex masks: Include phase information
- • Multi-tap masks: Model temporal context
Oracle Performance
- • Ideal Ratio Mask: theoretical upper bound
- • Assumes perfect knowledge of sources
- • Typical ceiling: ~12-15 dB SDR
- • Modern models can exceed this!
The neural network's job is to learn the complex mapping from mixture spectrograms to source masks, capturing patterns that define how different instruments and voices occupy the time-frequency plane.
# Neural network mask prediction pipeline
def forward(self, mixture_spec):
    # Input: Mixture spectrogram [batch, freq, time]
    batch_size, n_freq, n_time = mixture_spec.shape

    # U-Net encoder-decoder
    encoded = self.encoder(mixture_spec)  # Extract features
    decoded = self.decoder(encoded)       # Reconstruct at full resolution

    # Predict masks for each source
    masks = self.final_layers(decoded)    # [batch, n_sources, freq, time]

    # Apply softmax to ensure masks sum to 1
    masks = F.softmax(masks, dim=1)

    # Apply masks to mixture
    separated_specs = masks * mixture_spec.unsqueeze(1)

    return separated_specs  # [batch, n_sources, freq, time]
Training Considerations
- • Loss function: L1 on magnitude
- • Data augmentation: pitch/tempo shifts
- • Regularization prevents overfitting
- • Multi-scale loss captures details
Architecture Insights
- • Skip connections preserve detail
- • Depth captures long-range patterns
- • Batch normalization aids training
- • Dilated convolutions expand receptive field
Waveform Domain: Direct Mathematical Modeling
Waveform-domain models like Demucs bypass the spectrogram entirely, working directly with raw audio samples. This approach eliminates phase reconstruction issues but creates new mathematical challenges.
The Waveform Challenge
Temporal Resolution:
- • 44.1 kHz = 44,100 samples/second
- • 10-second song = 441,000 samples
- • Much higher resolution than spectrograms
Receptive Field:
- • Must capture musical structure
- • Typical requirement: ~1 second context
- • Requires deep or dilated convolutions
Learned Filterbank Approach
Instead of fixed STFT, learn an optimal analysis/synthesis filterbank through 1D convolutions.
✅ Advantages
- • No phase reconstruction artifacts
- • Optimal representations learned
- • End-to-end optimization
- • Can exceed IRM performance
❌ Challenges
- • Computationally expensive
- • Requires large receptive fields
- • Harder to interpret than spectrograms
- • More difficult to train
To capture long-range musical structure without prohibitive computational cost, waveform models use dilated convolutions—convolutions with gaps that exponentially expand the receptive field.
Dilation Mathematics
# Standard convolution
y[n] = Σ x[n-k] * h[k]  (k from 0 to K-1)

# Dilated convolution with dilation rate d
y[n] = Σ x[n-d*k] * h[k]  (k from 0 to K-1)

# Receptive field grows exponentially
Layer 1: dilation=1,  receptive_field=3
Layer 2: dilation=2,  receptive_field=7
Layer 3: dilation=4,  receptive_field=15
Layer 4: dilation=8,  receptive_field=31
...
Layer N: dilation=2^(N-1), receptive_field=2^N+1
Benefits for Audio
Efficiency: Linear parameter growth
Context: Captures long-term structure
Hierarchy: Multiple temporal scales
Musical: Captures rhythm patterns
Flexible: Various dilation schedules
Causal: Suitable for real-time
Evaluation Metrics: Quantifying Quality
SDR is the gold standard metric for source separation, measuring the ratio between the desired signal energy and all forms of distortion.
SDR Decomposition
s_target: True source signal
e_interf: Interference from other sources
e_noise: Background noise
e_artif: Processing artifacts
Excellent
Professional quality
Good
Usable for remixing
Poor
Audible artifacts
Source-to-Interference Ratio (SIR)
Measures contamination from other sources ("bleeding")
Source-to-Artifacts Ratio (SAR)
Measures processing artifacts introduced by the algorithm
⚠️ Metrics Limitations
- • Energy-based metrics don't capture perceptual quality
- • High SDR doesn't guarantee natural sound
- • Human evaluation still essential
- • Scale-Invariant SDR (SI-SDR) addresses some issues
Mathematical Insights: Key Takeaways
The Fourier Transform is Foundational
Whether working in spectrograms or learning custom representations, the mathematical insights from Fourier analysis—decomposing complex signals into simpler components—remain central to all separation approaches.
Phase is the Limiting Factor
The difficulty of modeling phase relationships explains why spectrogram-based methods hit theoretical ceilings and why end-to-end waveform models achieve superior quality—they jointly model magnitude and phase.
Trade-offs are Everywhere
Time vs frequency resolution, computational cost vs quality, interpretability vs performance—understanding these mathematical trade-offs is crucial for choosing the right approach for your application.
Context is King
Whether through dilated convolutions, attention mechanisms, or BiLSTMs, the mathematical challenge is always capturing sufficient temporal and spectral context to make informed separation decisions.
Evaluation Requires Care
Mathematical metrics like SDR provide objective benchmarks, but they don't capture all aspects of perceptual quality. The best separation systems combine mathematical rigor with human evaluation.